Documentation
AAY-chart
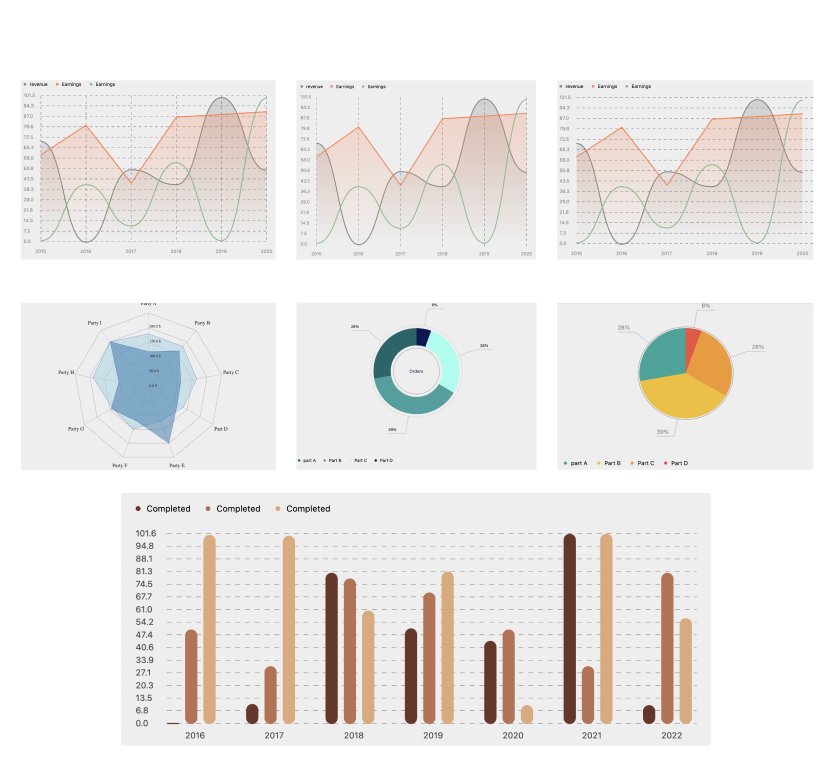
The library contains several chart composables for usage in Kotlin Multiplatform projects and Android Native.
Currently supported platforms are Desktop Android IOS and Web


How to use?
Add dependency in your module build.gradle
dependencies {
    implementation("io.github.thechance101:chart:$latest_release")
}
Examples
- Show Line Chart in Jetpack Compose:
@Composable
fun LineChartSample() {

    val testLineParameters: List<LineParameters> = listOf(
        LineParameters(
            label = "revenue",
            data = listOf(70.0, 00.0, 50.33, 40.0, 100.500, 50.0),
            lineColor = Color.Gray,
            lineType = LineType.CURVED_LINE,
            lineShadow = true,
        ),
        LineParameters(
            label = "Earnings",
            data = listOf(60.0, 80.6, 40.33, 86.232, 88.0, 90.0),
            lineColor = Color(0xFFFF7F50),
            lineType = LineType.DEFAULT_LINE,
            lineShadow = true
        ),
        LineParameters(
            label = "Earnings",
            data = listOf(1.0, 40.0, 11.33, 55.23, 1.0, 100.0),
            lineColor = Color(0xFF81BE88),
            lineType = LineType.CURVED_LINE,
            lineShadow = false,
        )
    )

    Box(Modifier) {
        LineChart(
            modifier = Modifier.fillMaxSize(),
            linesParameters = testLineParameters,
            isGrid = true,
            gridColor = Color.Blue,
            xAxisData = listOf("2015", "2016", "2017", "2018", "2019", "2020"),
            animateChart = true,
            showGridWithSpacer = true,
            yAxisStyle = TextStyle(
                fontSize = 14.sp,
                color = Color.Gray,
            ),
            xAxisStyle = TextStyle(
                fontSize = 14.sp,
                color = Color.Gray,
                fontWeight = FontWeight.W400
            ),
            yAxisRange = 14,
            oneLineChart = false,
            gridOrientation = GridOrientation.VERTICAL
        )
    }
}

- Show Bar Chart in Jetpack Compose:
@Composable
fun BarChartSample() {

    val testBarParameters: List<BarParameters> = listOf(
        BarParameters(
            dataName = "Completed",
            data = listOf(0.6, 10.6, 80.0, 50.6, 44.0, 100.6, 10.0),
            barColor = Color(0xFF6C3428)
        ),
        BarParameters(
            dataName = "Completed",
            data = listOf(50.0, 30.6, 77.0, 69.6, 50.0, 30.6, 80.0),
            barColor = Color(0xFFBA704F),
        ),
        BarParameters(
            dataName = "Completed",
            data = listOf(100.0, 99.6, 60.0, 80.6, 10.0, 100.6, 55.99),
            barColor = Color(0xFFDFA878),
        ),
    )

    Box(Modifier.fillMaxSize()) {
        BarChart(
            chartParameters = testBarParameters,
            gridColor = Color.DarkGray,
            xAxisData = listOf("2016", "2017", "2018", "2019", "2020", "2021", "2022"),
            isShowGrid = true,
            animateChart = true,
            showGridWithSpacer = true,
            yAxisStyle = TextStyle(
                fontSize = 14.sp,
                color = Color.DarkGray,
            ),
            xAxisStyle = TextStyle(
                fontSize = 14.sp,
                color = Color.DarkGray,
                fontWeight = FontWeight.W400
            ),
            yAxisRange = 15,
            barWidth = 20.dp
        )
    }
}

- Show Pie Chart in Jetpack Compose:
@Composable
fun PieChartSample() {

    val testPieChartData: List<PieChartData> = listOf(
        PieChartData(
            partName = "part A",
            data = 500.0,
            color = Color(0xFF22A699),
        ),
        PieChartData(
            partName = "Part B",
            data = 700.0,
            color = Color(0xFFF2BE22),
        ),
        PieChartData(
            partName = "Part C",
            data = 500.0,
            color = Color(0xFFF29727),
        ),
        PieChartData(
            partName = "Part D",
            data = 100.0,
            color = Color(0xFFF24C3D),
        ),
    )

    PieChart(
        modifier = Modifier.fillMaxSize(),
        pieChartData = testPieChartData,
        ratioLineColor = Color.LightGray,
        textRatioStyle = TextStyle(color = Color.Gray),
    )
}
- Show Donut Chart in Jetpack Compose:
@Composable
fun DonutChartSample() {

    val testPieChartData: List<PieChartData> = listOf(
        PieChartData(
            partName = "part A",
            data = 500.0,
            color = Color(0xFF0B666A),
        ),
        PieChartData(
            partName = "Part B",
            data = 700.0,
            color = Color(0xFF35A29F),
        ),
        PieChartData(
            partName = "Part C",
            data = 500.0,
            color = Color(0xFF97FEED),
        ),
        PieChartData(
            partName = "Part D",
            data = 100.0,
            color = Color(0xFF071952),
        ),
    )

    DonutChart(
        modifier = Modifier.fillMaxSize(),
        pieChartData = testPieChartData,
        centerTitle = "Orders",
        centerTitleStyle = TextStyle(color = Color(0xFF071952)),
        outerCircularColor = Color.LightGray,
        innerCircularColor = Color.Gray,
        ratioLineColor = Color.LightGray,
    )
}
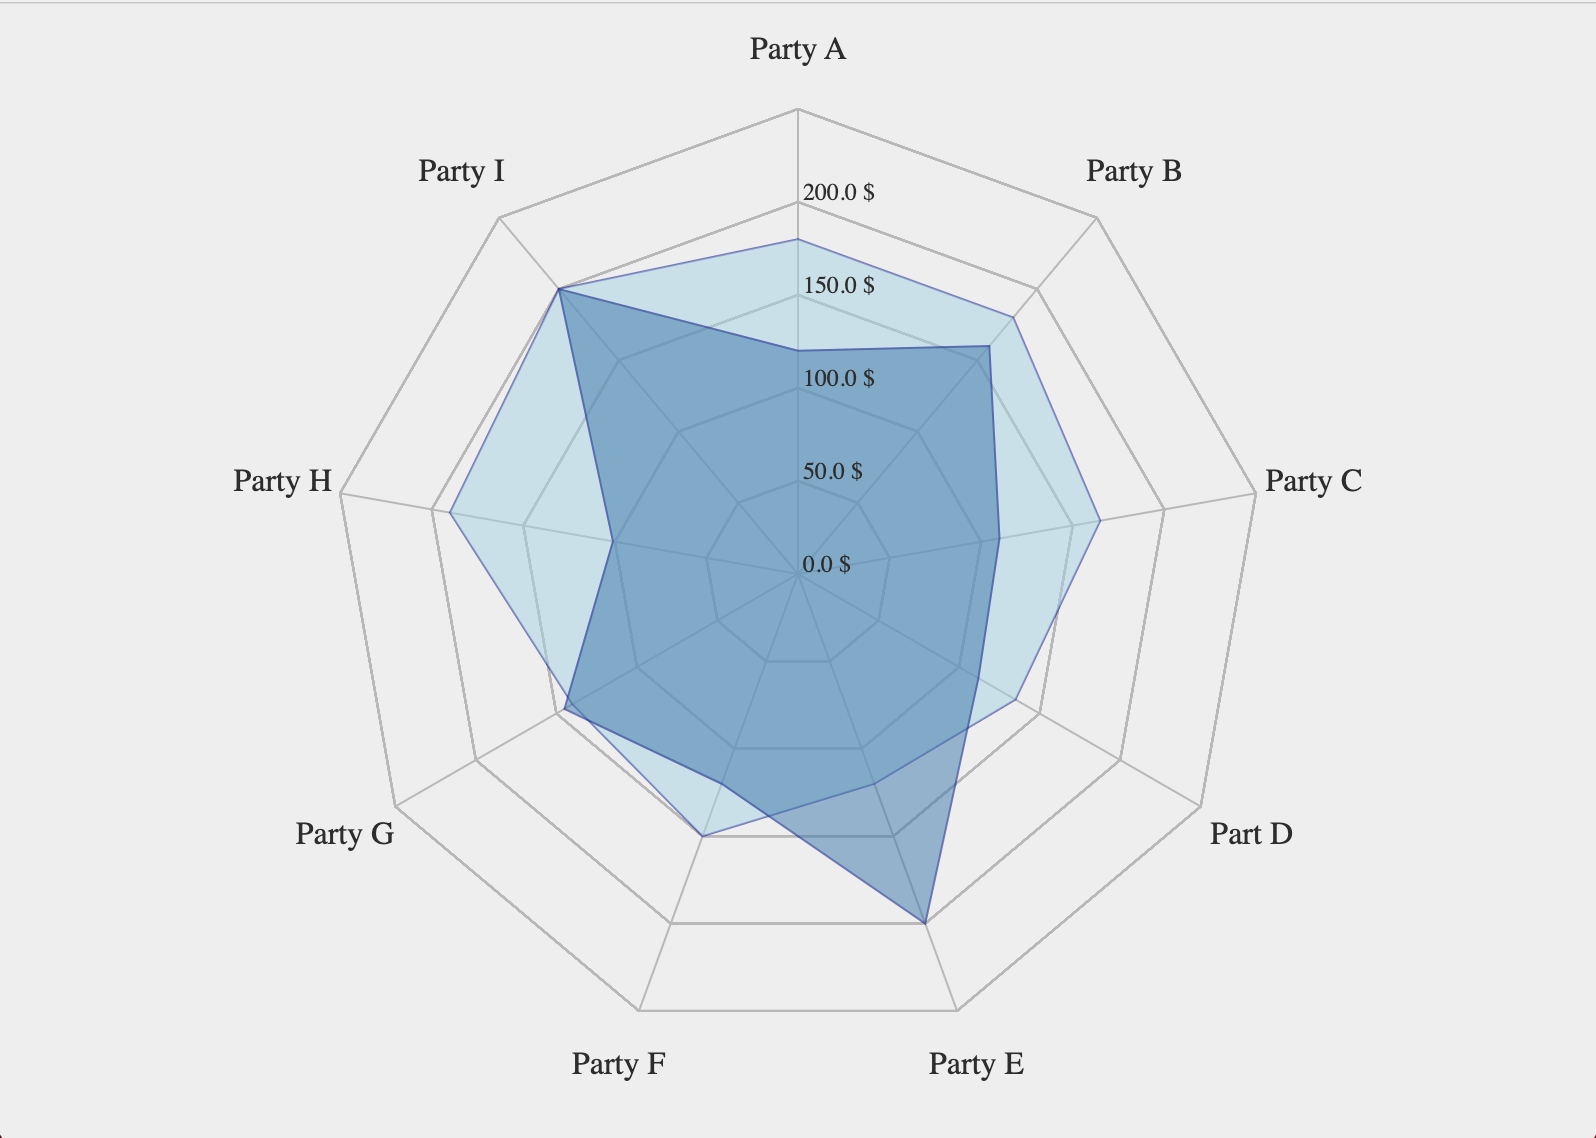
- Show Radar Chart in Jetpack Compose:
@Composable
fun RadarChartSample() {
    val radarLabels =
        listOf(
            "Party A",
            "Party A",
            "Party A",
            "Part A",
            "Party A",
            "Party A",
            "Party A",
            "Party A",
            "Party A"
        )
    val values2 = listOf(120.0, 160.0, 110.0, 112.0, 200.0, 120.0, 145.0, 101.0, 200.0)
    val values = listOf(180.0, 180.0, 165.0, 135.0, 120.0, 150.0, 140.0, 190.0, 200.0)
    val labelsStyle = TextStyle(
        color = Color.Black,
        fontFamily = FontFamily.Serif,
        fontWeight = FontWeight.Medium,
        fontSize = 10.sp
    )

    val scalarValuesStyle = TextStyle(
        color = Color.Black,
        fontFamily = FontFamily.Serif,
        fontWeight = FontWeight.Medium,
        fontSize = 10.sp
    )

    RadarChart(
        modifier = Modifier.fillMaxSize(),
        radarLabels = radarLabels,
        labelsStyle = labelsStyle,
        netLinesStyle = NetLinesStyle(
            netLineColor = Color(0x90ffD3CFD3),
            netLinesStrokeWidth = 2f,
            netLinesStrokeCap = StrokeCap.Butt
        ),
        scalarSteps = 2,
        scalarValue = 200.0,
        scalarValuesStyle = scalarValuesStyle,
        polygons = listOf(
            Polygon(
                values = values,
                unit = "$",
                style = PolygonStyle(
                    fillColor = Color(0xffc2ff86),
                    fillColorAlpha = 0.5f,
                    borderColor = Color(0xffe6ffd6),
                    borderColorAlpha = 0.5f,
                    borderStrokeWidth = 2f,
                    borderStrokeCap = StrokeCap.Butt,
                )
            ),
            Polygon(
                values = values2,
                unit = "$",
                style = PolygonStyle(
                    fillColor = Color(0xffFFDBDE),
                    fillColorAlpha = 0.5f,
                    borderColor = Color(0xffFF8B99),
                    borderColorAlpha = 0.5f,
                    borderStrokeWidth = 2f,
                    borderStrokeCap = StrokeCap.Butt
                )
            )
        )
    )
}
Contributors
Contributing
Contributions are welcome! Please read our CONTRIBUTING.md for more information on how to get started.
CI/CD
We use GitHub Actions for our CI/CD. All Pull Requests are automatically tested, and releases are published to Maven Central.
MIT License
Copyright (c) 2023 The Chance

permission is hereby granted, free of charge, to any person obtaining a copy
of this software and associated documentation files (the "Software"), to deal
in the Software without restriction, including without limitation the rights
to use, copy, modify, merge, publish, distribute, sublicense, and/or sell
copies of the Software, and to permit persons to whom the Software is
furnished to do so, subject to the following conditions:

The above copyright notice and this permission notice shall be included in all
copies or substantial portions of the Software.

THE SOFTWARE IS PROVIDED "AS IS", WITHOUT WARRANTY OF ANY KIND, EXPRESS OR
IMPLIED, INCLUDING BUT NOT LIMITED TO THE WARRANTIES OF MERCHANTABILITY,
FITNESS FOR A PARTICULAR PURPOSE AND NONINFRINGEMENT. IN NO EVENT SHALL THE
AUTHORS OR COPYRIGHT HOLDERS BE LIABLE FOR ANY CLAIM, DAMAGES OR OTHER
LIABILITY, WHETHER IN AN ACTION OF CONTRACT, TORT OR OTHERWISE, ARISING FROM,
OUT OF OR IN CONNECTION WITH THE SOFTWARE OR THE USE OR OTHER DEALINGS IN THE
SOFTWARE.
Similar Libraries
Compose Color Picker
Jetpack Compose Android Color Picker 🎨
Color PickerUI Component
Charty
An Elementary Chart library for Jetpack Compose. You can implement any kind of chart natively designed for Compose.
Chart
Collapsible App Bar
Collapsible App bar made with Jetpack Compose & Motion Compose
ExamplesUI Component
Dropdown
💧 A Powerful and customizable Jetpack Compose dropdown menu with cascade and animations
MenusUI Component
Browse by Category


Be the first to discover new Compose libraries
Curated Insights
Digest in 5 minutes or less
Android Analysis
Entertaining takes on happenings
Insider Tips
From top Android developers
Hidden Gems
You won't find elsewhere
"
"Dispatch is truly a newsletter, not just a digest of links. Vinay adds a delightful touch of humor and personality to a thoughtful analysis of the Android happenings of the month. I always learn something just by skimming it that makes me want to bookmark the issue now and dig deeper later."
— Zach Klippenstein
ex-Jetpack Compose Team @ Google, Square, Amazon
Join thousands of Android devs who look forward to Dispatch every week

