Composable Graphs
232 stars
by jaikeerthick
✨ A very Minimal, Sleek and Powerful Graph library for Android built with Kotlin & Jetpack Compose
View on GitHubDocumentation

Composable-Graphs





✨ A very Minimal, Sleek and Lightweight Graph library for Android using Jetpack Compose
Important ⚠️
Please migrate to v1.2.2 or above if you are using lower versions and refer the updated documentation below for the usage
Gradle Setup
In settings.gradle.kts, Add jitpack url
dependencyResolutionManagement {
    repositoriesMode.set(RepositoriesMode.FAIL_ON_PROJECT_REPOS)
    repositories {
        ...
        maven(url = "https://jitpack.io") // Add jitpack
    }
}
In build.gradle.kts, in dependencies block, add
implementation("com.github.jaikeerthick:Composable-Graphs:v{version}") //ex: v1.2.3
Graphs Available
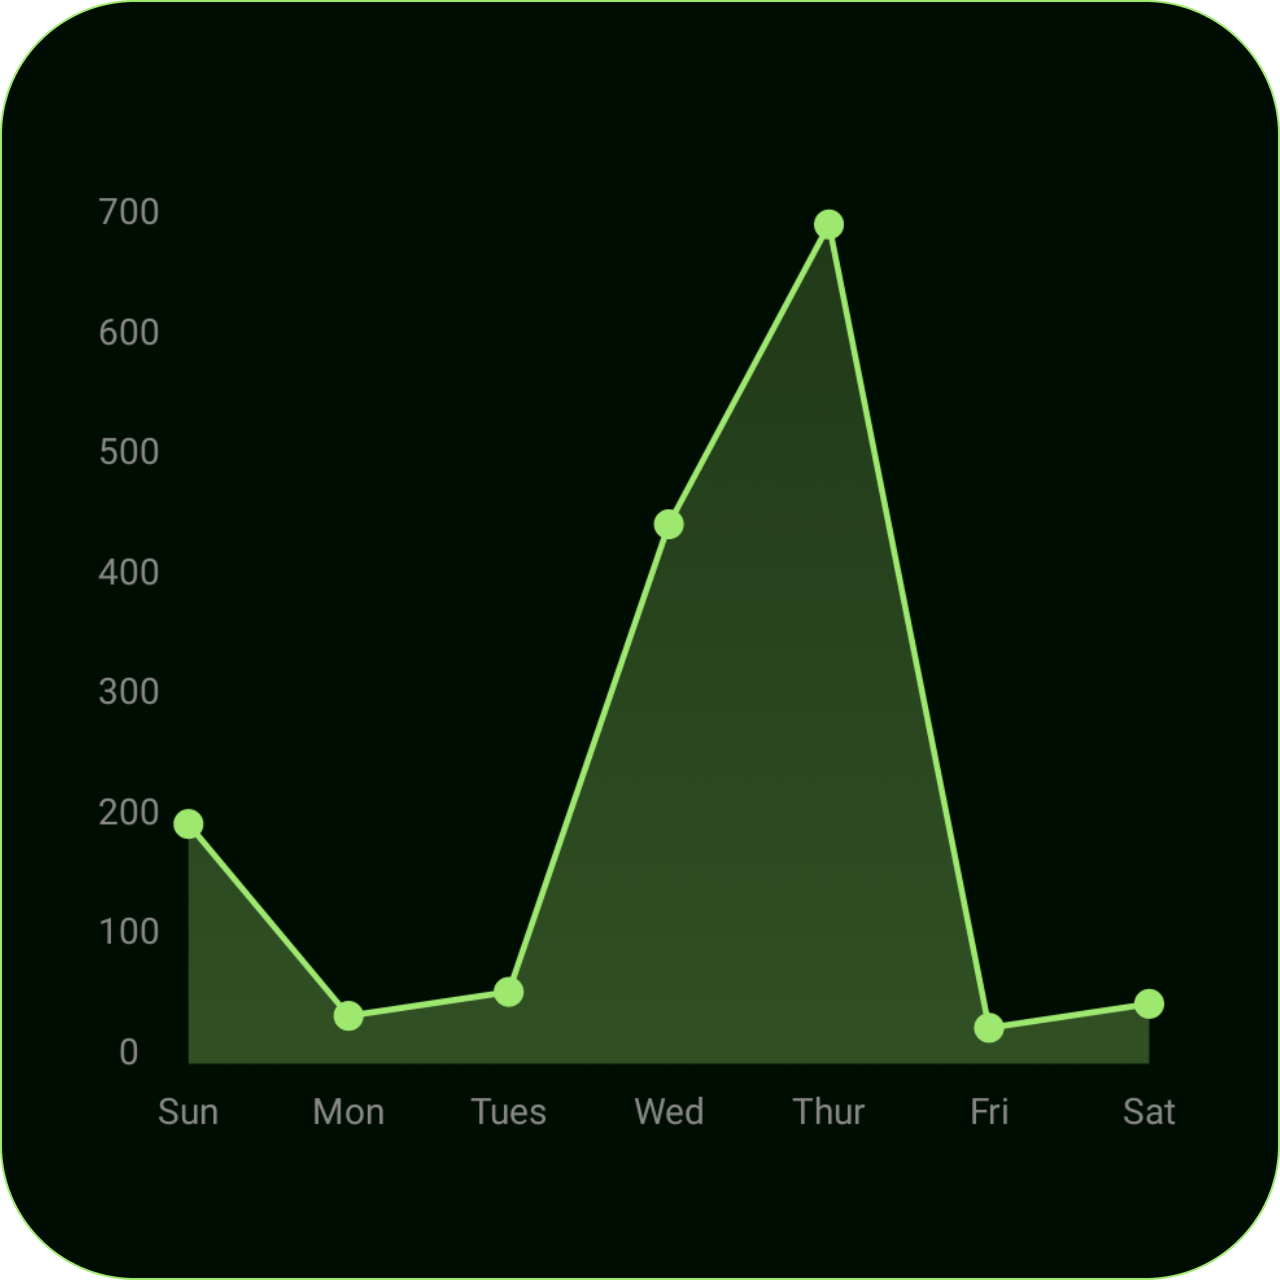
- Line Graph
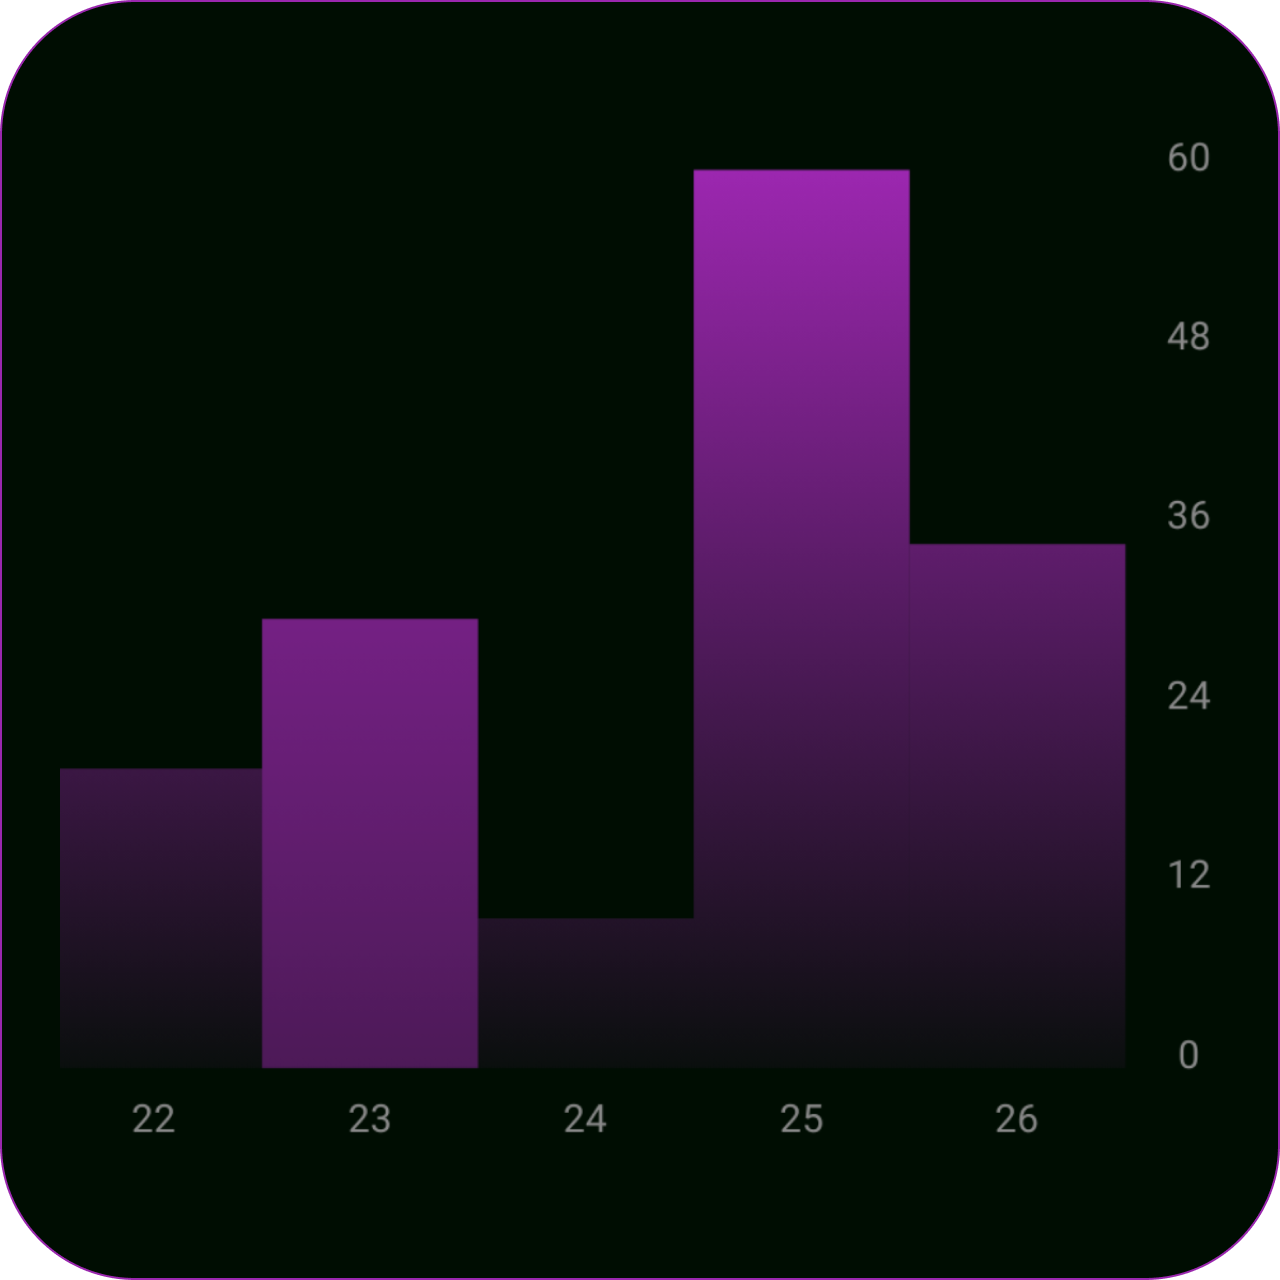
- Bar Graph
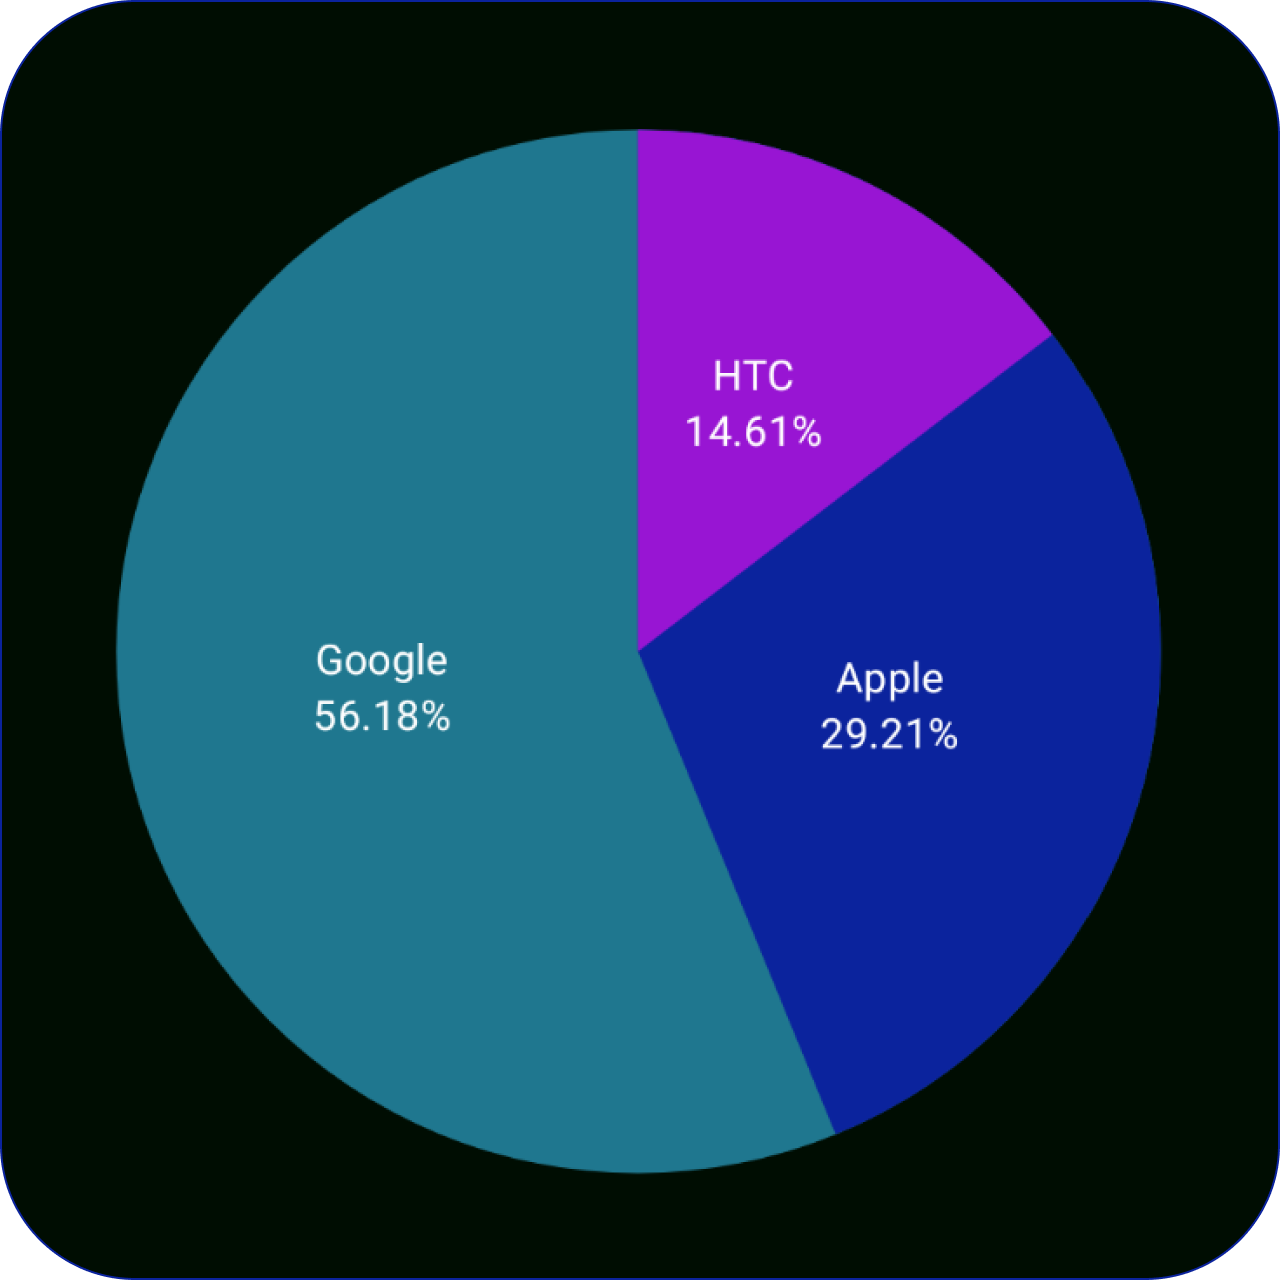
- Pie Chart
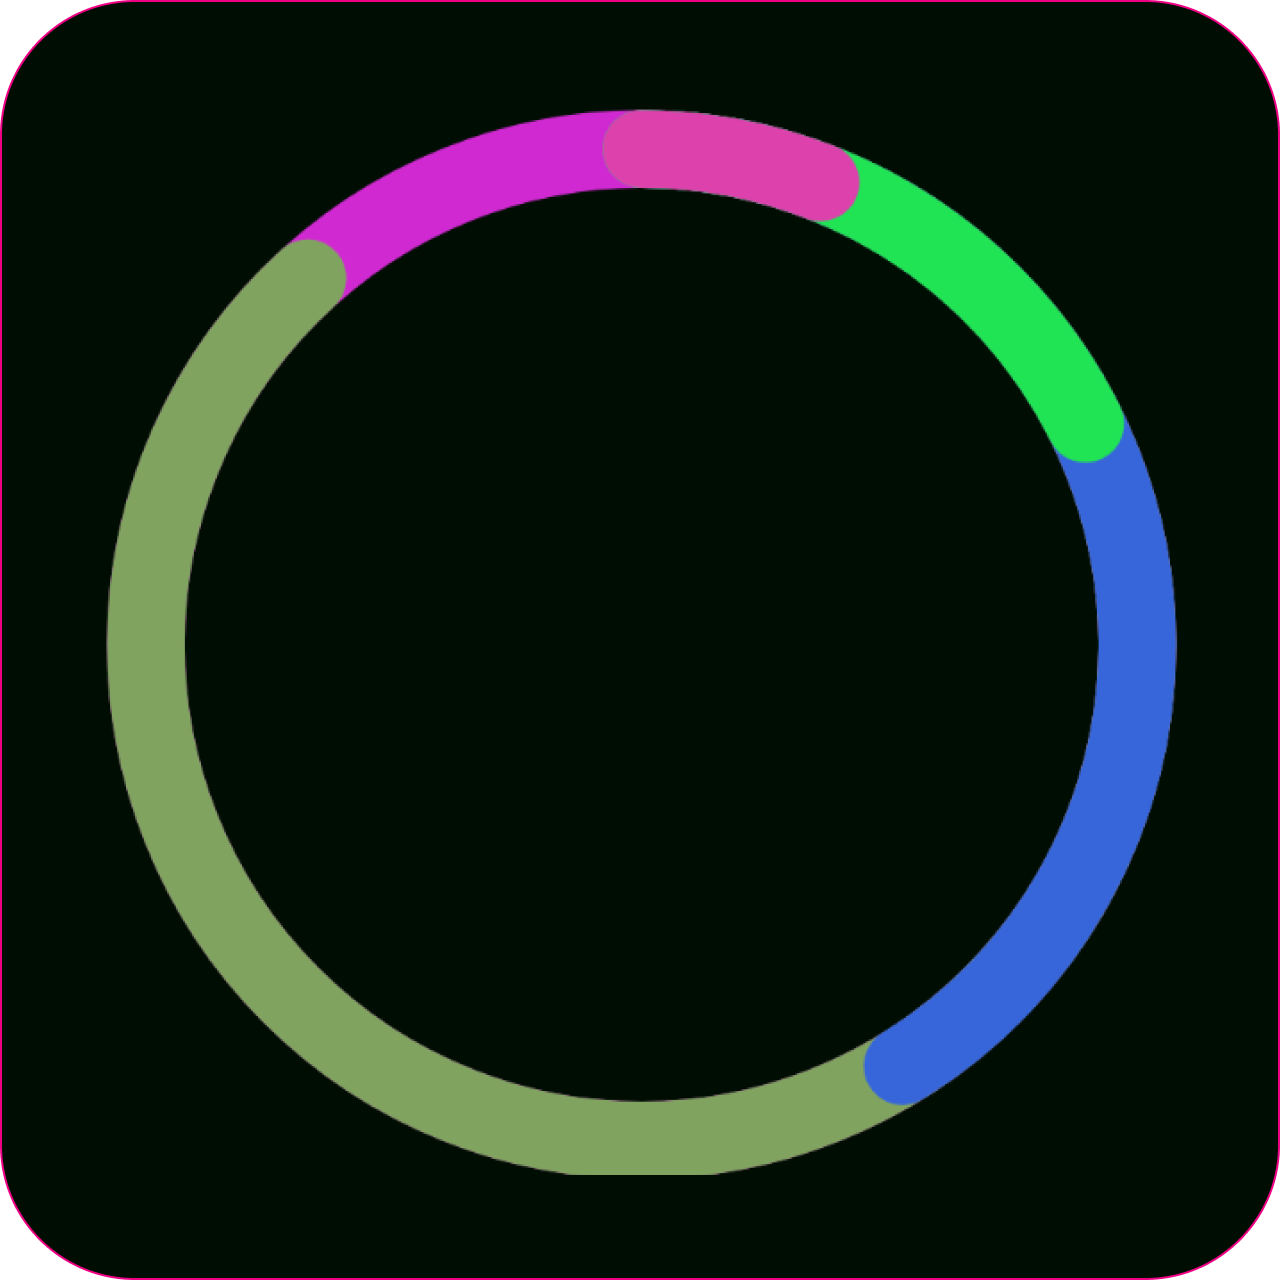
- Donut Chart (Normal, Progressive)
Preview
Usage
1. Line Graph
val data = listOf(LineData(x = "Sun", y = 200), LineData(x = "Mon", y = 40))

LineGraph(
    modifier = Modifier
        .padding(horizontal = 16.dp, vertical = 12.dp),
    data = data,
    onPointClick = { value: LineData ->
        // do something with value
    },
)
2. Bar Graph
BarGraph(
    data = listOf(BarData(x = "22", y = 20), BarData(x = "23", y = 30)),
)
3. Pie Chart
// sample data
val pieChartData = listOf(
    PieData(value = 130F, label = "HTC", color = Color.Green),
    PieData(value = 260F, label = "Apple", labelColor = Color.Blue),
    PieData(value = 500F, label = "Google"),
)

// composable
PieChart(
    modifier = Modifier
        .padding(vertical = 20.dp)
        .size(220.dp),
    data = pieChartData,
    onSliceClick = { pieData ->
        Toast.makeText(context, "${pieData.label}", Toast.LENGTH_SHORT).show()
    }
)
4. Donut Chart
Donut Chart supports 2 types of implementations: DonutChartType.Normal and DonutChartType.Progressive()
// sample values
val donutChartData = listOf(
    DonutData(value = 30F),
    DonutData(value = 60F),
    DonutData(value = 70F),
    DonutData(value = 50F),
)

// composable
DonutChart(
    modifier = Modifier
        .padding(vertical = 20.dp)
        .size(220.dp),
    data = donutChartData,
    type = DonutChartType.Progressive(),
    style = viewModel.donutChartStyle,
)
Styling
Create stunning & colorful graphs with awesome styling🎨. Composable-Graphs supports various styling helpers:
- Modifier (Yes, We heard you!💬)
- Visibility
- Colors
- LabelPosition
val style = BarGraphStyle(
                    visibility = BarGraphVisibility(
                        isYAxisLabelVisible = true
                    ),
                    yAxisLabelPosition = LabelPosition.RIGHT
                )

val style2 = LineGraphStyle(
                    visibility = LinearGraphVisibility(
                        isYAxisLabelVisible = false,
                        isCrossHairVisible = true
                    ),
                    colors = LinearGraphColors(
                        lineColor = GraphAccent2,
                        pointColor = GraphAccent2,
                        clickHighlightColor = PointHighlight2,
                        fillType = LineGraphFillType.Gradient(
                            brush = Brush.verticalGradient(listOf(Color.Green, Color.Yellow))
                        )
                    )
                )
Work In Progress (v1.2.4) :
Features
- Show y values above points & bars (sticky)
Interaction
- Ability to turn off interaction on charts (disable clicks)
Grid
- Customize grid color
- Ability to control visibility of x and y axis grids separately
Highlight
- Highlight Shape for Line Graph - Circle, HallowedCircle, Triangle, Square
- Control size of the highlight
Contributions are welcome ❤️
Related Questions
Browse by Category


Be the first to discover new Compose libraries
Curated Insights
Digest in 5 minutes or less
Android Analysis
Entertaining takes on happenings
Insider Tips
From top Android developers
Hidden Gems
You won't find elsewhere
"
"Dispatch is a must read for Android devs today and my go-to for keeping up with all things Jetpack Compose. I eagerly await each issue, not just for the Compose gems honestly but for Vinay's unique insights, stories, and finds. The Dev Delight and Featured Dev sections are particular favorites of mine! He really should do a podcast."
— Kaushik Gopal
Principal Engineer @ Instacart | Host of the Fragmented Podcast | GDE for Android
Join thousands of Android devs who look forward to Dispatch every week


