Koalaplot
Koala Plot is a Compose Multiplatform based charting and plotting library for data visualization.
View on GitHubDocumentation

Koala Plot
Koala Plot is a Compose Multiplatform based charting
and plotting library
allowing you to build great looking interactive charts for
Android, desktop, ios, and web using a single API
and code base.
Try out
the web version of the samples
for a quick look at the possibilities when using Koala Plot.
This project is in a developmental state but several plot types are available and stable. We
encourage you to give it a try, make suggestions for
improvement, and
even contribute! It is
expected that the API surface and functionality will change as we gain experience using the library
in applications. API and binary compatibility might not be maintained
between 0.x releases, but we strive to maintain API compatibility between minor versions.
Current Features
Most elements of a plot are Composables and can therefore be easily customized. This includes things
like colors, fonts, borders, shapes, user interaction, etc.
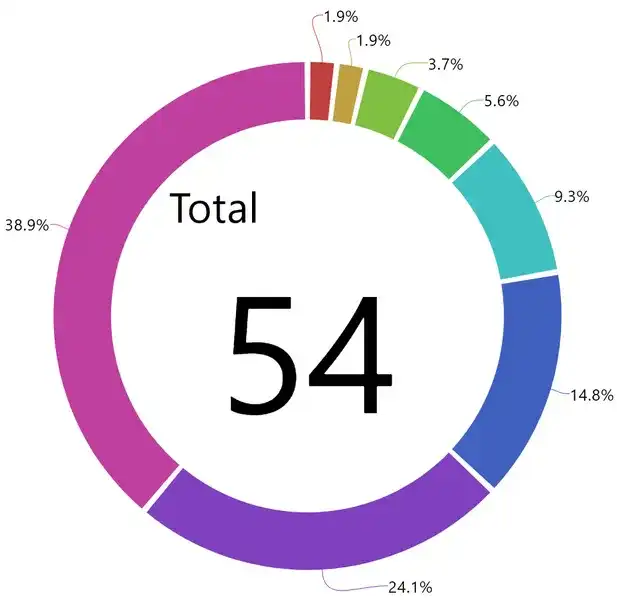
- Pie and donut chart
- Composable slices, with default implementation that can react to hovering
- Optional Composable labels and Composable connectors with provided linear and bezier
implementations - Composable content for donut chart centers
- Customizable first-draw animation
- Line graphs
- Linear or Log exes
- Numeric or category axes
- Composable axis titles and value labels
- Optional Composable symbols for data points
- Optional Composable symbols at each data point with default implementations
- Zoom and pan one or both axes
- Optional shaded areas (area chart)
- Mouse tracking
- Annotations
- Linear, stairstep, and Bezier smoothed curves
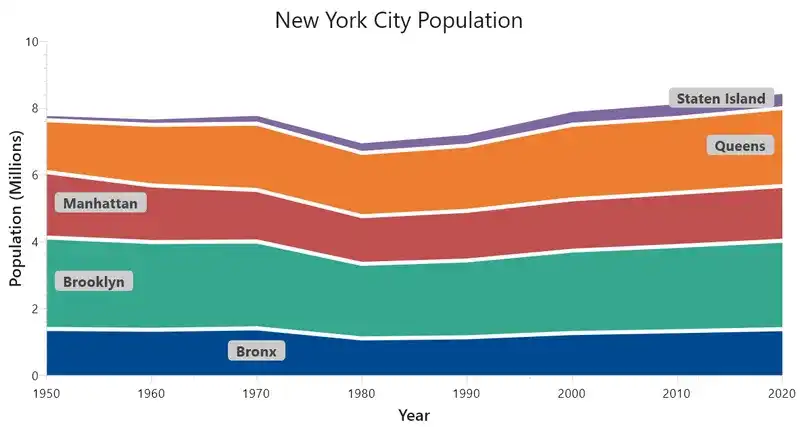
- Stacked area graphs
- Plots multiple lines with shaded areas between them and accumulated values
- Similar feature set as the Line chart
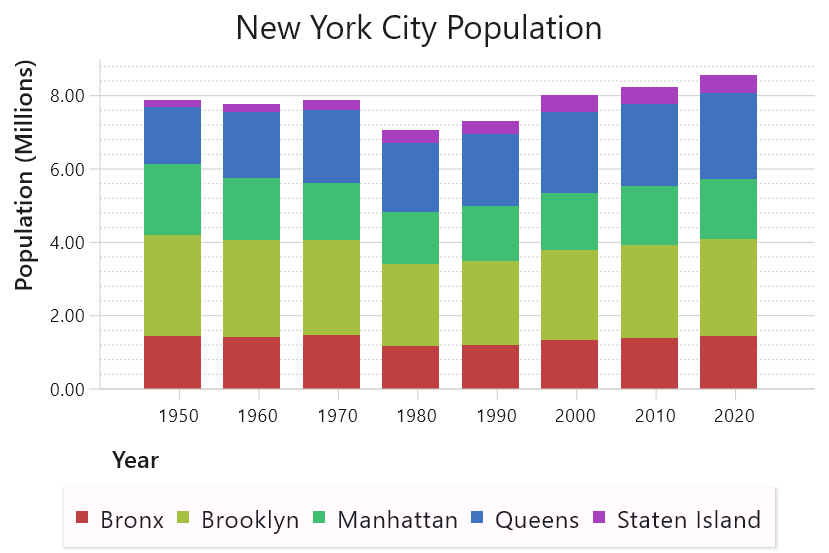
- Vertical bar graph
- Linear or Log y-axis
- Numeric or category x-axis
- Composable vertical bars with a provided default implementation
- Support for clustered and stacked bars
- Support for negative values and bars that don't start at 0
- Customizable first-draw animation
- Zoom and pan one or both axes (except for mobile platforms within js and wasmJs)
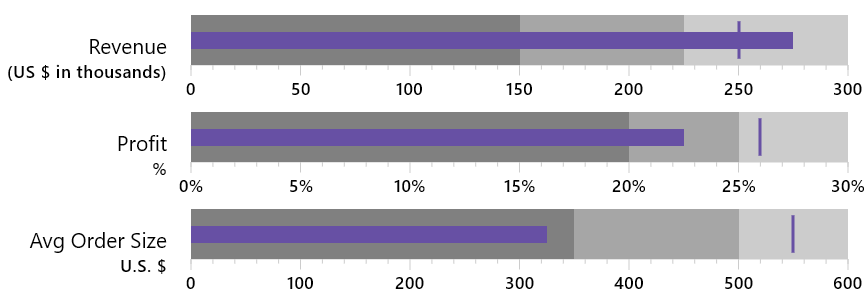
- Bullet Graph
- Individual or multiple vertically aligned bullet graphs
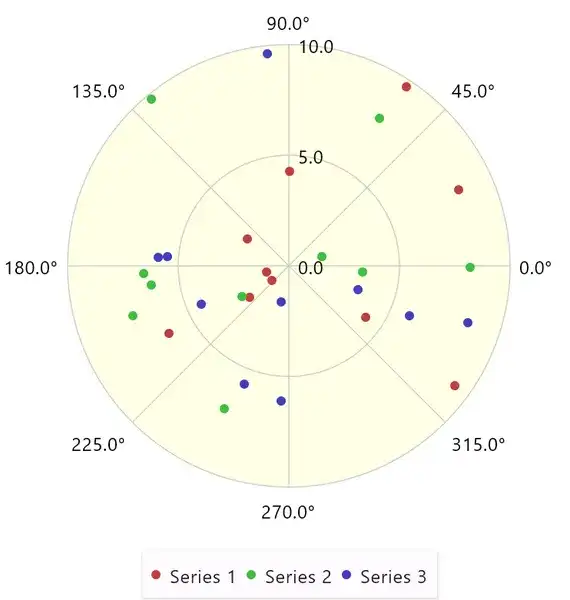
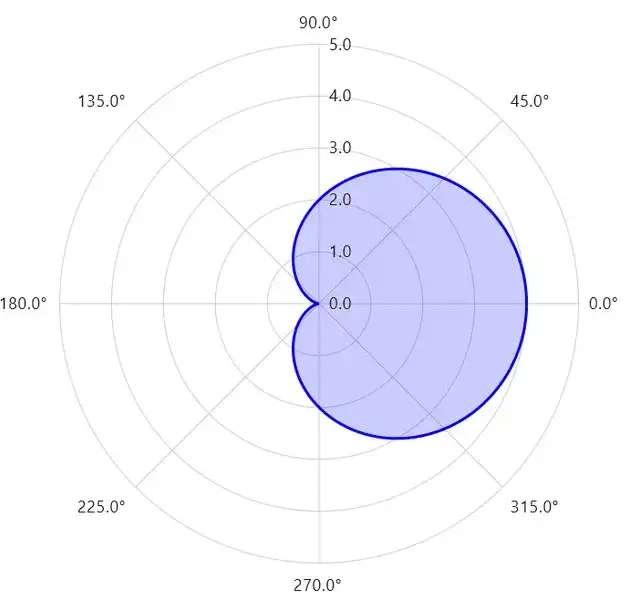
- Radar/Polar/Spider plots
- Lines, areas, symbols, or a combination
- Configurable origin position and angle orientation (clockwise/counter-clockwise)
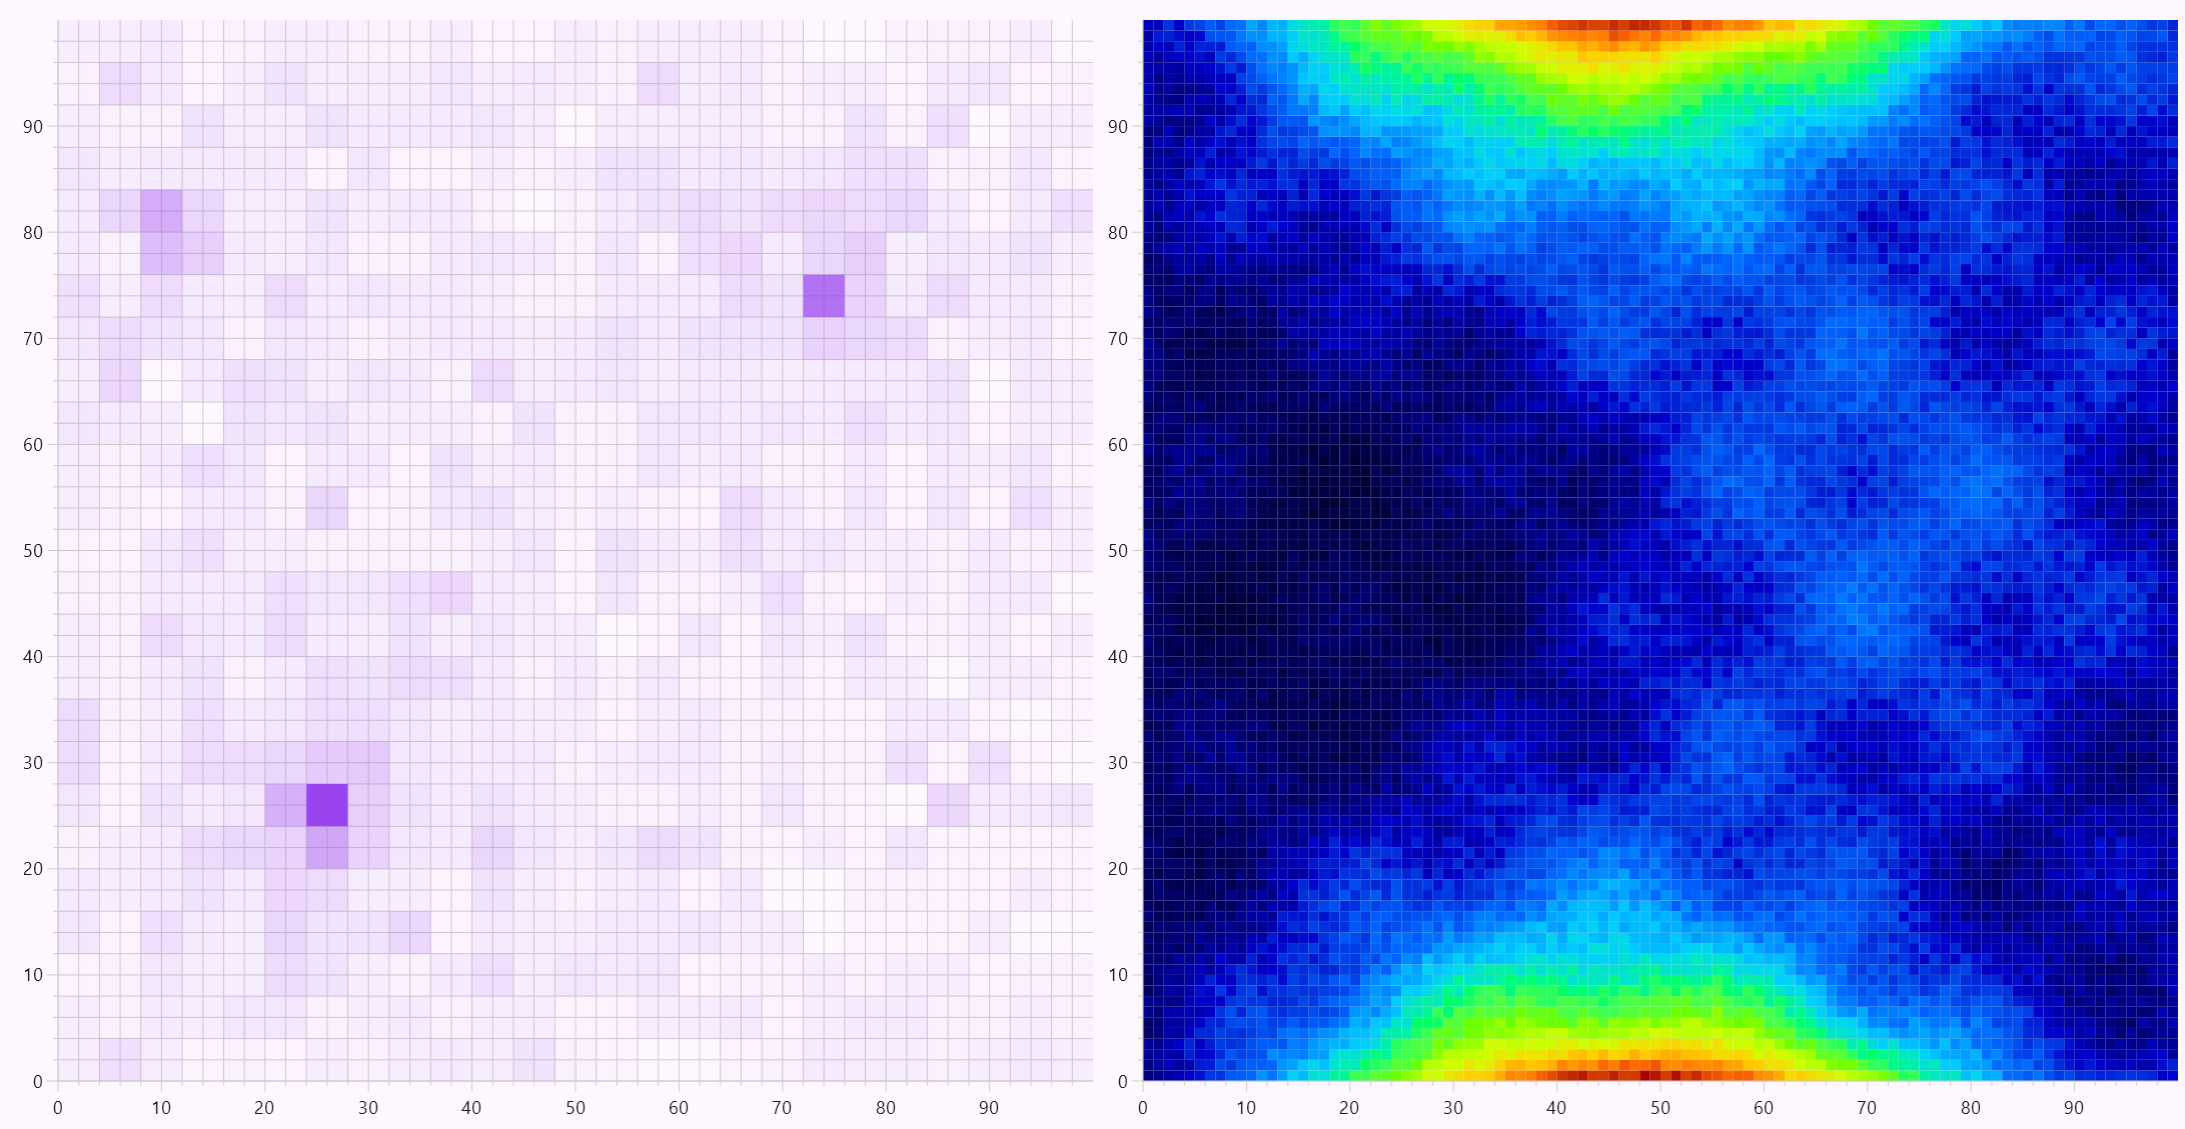
- Heatmaps
- Chart layout
- Combines an optional Composable title, plot, and legend with any of 4 positions
- Legends
- Single column
- Flow-layout
Getting Started
- Add the mavenCentral repository to your project's build.gradle.kts
repositories {
  mavenCentral()
}
- Include Koala Plot core as a dependency in your project's build.gradle.kts
dependencies {
  implementation("io.github.koalaplot:koalaplot-core:0.11.1")
}
You can also see a complete example of a build.gradle.kts in
the samples.
- Start coding
BulletGraphs {
  bullet(FloatLinearAxisModel(0f..300f)) {
    label {
      Column(
        horizontalAlignment = Alignment.End,
        modifier = Modifier.padding(end = KoalaPlotTheme.sizes.gap)
      ) {
        Text("Revenue 2005 YTD", textAlign = TextAlign.End)
        Text(
          "(US $ in thousands)",
          textAlign = TextAlign.End,
          style = MaterialTheme.typography.labelSmall
        )
      }
    }
    axis { labels { Text("${it.toInt()}") } }
    comparativeMeasure(260f)
    featuredMeasureBar(275f)
    ranges(0f, 200f, 250f, 300f)
  }
}
Documentation
Also see the sample repository for code examples.
Contributing
Contributions are welcome. Further details can be found in the
Contributing Guidelines
Examples


Similar Libraries
Charty
An Elementary Chart library for Jetpack Compose. You can implement any kind of chart natively designed for Compose.
Fragula
🧛 Fragula is a swipe-to-dismiss extension for navigation component library for Android
Showkase
🔦 Showkase is an annotation-processor based Android library that helps you organize, discover and search Jetpack Compose UI elements
Accompanist
A collection of extension libraries for Jetpack Compose


